Access the System Diagnostics Overview page by navigating to Community Solution > Dashboards > System Diagnostics > System Diagnostics.
Upon start up, you are directed to the overview page. Use this page to get an overview of your application and environment health. The overview page contains four condensed reports:
- Database Usage: The pie chart displays how much storage is available and in use in an environment. Databases are sorted into used, unused, or allocated types.
NOTE: You will receive an error message if database usage data cannot be retrieved.
-
User Licenses: This shows licensed user data in two tiles, Active Licenses and Total Licenses.
-
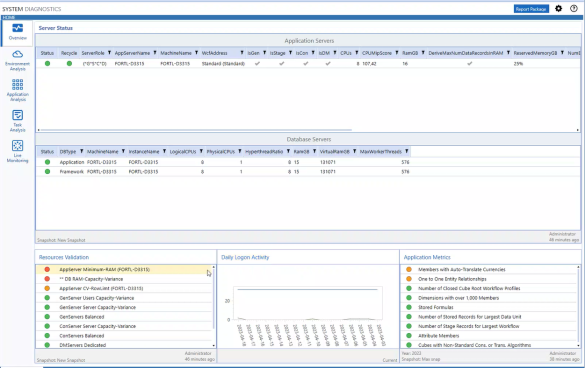
Application Metrics: This displays the most recent changes (business rules, formulas, records, and more) in a snapshot of the current application. You can drill down into each metric for a detailed view of the change.
-
Daily logon activity
Click the title of a condensed report to navigate to the appropriate page in System Diagnostics.
Click the Overview tab to return to the home page.


